Objectives
The main objectives of GreenView, related to its functionality and area of interest are:
1. Develop the scientific algorithm for the estimation and calibration of environmental parameters;
2. Design the Grid based parallel and distributed processing;
3. Acquire the satellite datasets and organize the distributed database of input and output data;
4. Implement and test the GreenView functionality;
5. Test and evaluate the performance of the Grid based execution in batch and user interactive modes;
6. Improve the performance by appropriate calibration of data and process configuration;
7. Execute the application for real data in production mode.
Requirements
1. In case of vegetation or temperature parameters retrieve from satellite measurements, GreenView should work on any region from Central Eastern Europe. These parameters are obtained from MOD13, MOD15 and MOD17 products derived from the data of the MODIS sensor onboard Terra and Aqua satellites. 2. The calibration procedure estimates BIOME-BGC model-related parameters for Hegyátsál region in Hungary country, and it is based on a comparison between satellite and ground based measurements. Because this application requires a higher computational cost, it runs on a GRID infrastructure. On this infrastructure, the entire application could be executed in a parallel and distributed manner. 3. GreenView application could be extended with atmospheric pollutants (ozone, nitrous oxides, etc.) components, what makes it interesting for both the scientific and social community. 4. GreeView is a web application that is based on gProcess platform, gLite platform and GRID infrastructure and it is developed using Java and Flex 3.3 technologies. 5. Another important requirement refers to the fact that the interface should hide the backhand complexity of this application. In this way non-technical persons could use it and adapt it to their needs.
- Free use the GreenView application
- User manual
- To obtain new user credentials (username, password) in order to use the application, please email us at: This e-mail address is being protected from spambots. You need JavaScript enabled to view it
Collaboration
Technical University of Cluj-Napoca (RO), Eötvös Loránd University (HU), Research and Educational Networking Association of Moldova (MD), National Center for Information Technology of University "Politehnica" Bucharest (RO), Computer Science Department of West University of Timisoara (RO), State Hydrometeorological Service (MD), Faculty of Radioelectronics and Telecommunications of Technical University of Moldova (MD)
The Greenview application is heavily dependent on the JRA1 development ESIP platform. It provides a flexible and extensible framework, where additional modules can be created by other collaborators. The application has been shown to scale from 70 to 200 CPUs in a distributed environment.
The GreenView application offers three different functionalities: coarse to fine interpolation, fine to coarse interpolation, and GPP computing. Each of these functionalities implements one or more algorithms. The general architecture of this application is presented in following image.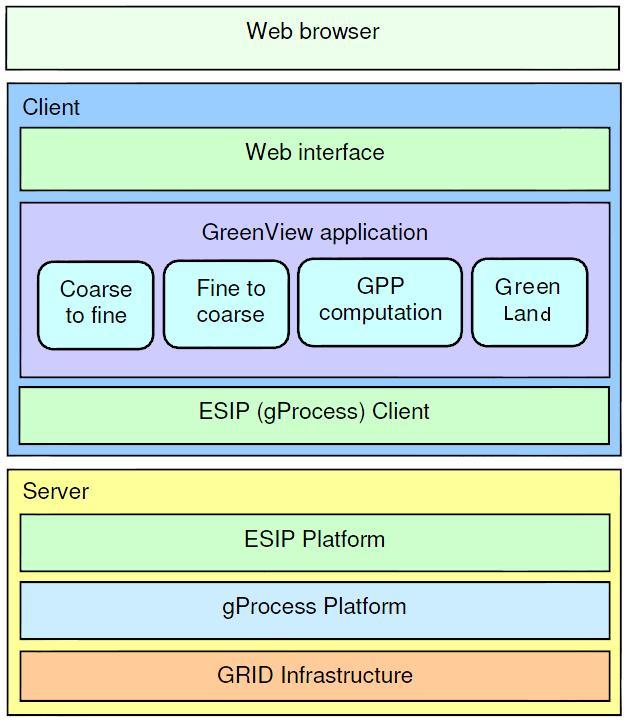
The client-server structure makes GreenView application accessible over the Internet, by using different web browsers (e.g. IE, Mozilla, Chrome, etc.). The interface is personalized for each of the three components (coarse to fine, fine to coarse and GPP component), by using different sets of buttons, text inputs, combo boxes and other combined tools. GRID process execution is based on workflows, that describe the resources and atomic components that are used, and also the way they are combined in order to produce a valid execution graph. gProcess client is used for describing such a workflow. ESIP is based on gProcess platform, which runs on the server and it is used to plan and manage the job execution over the Grid infrastructure. Therefore, the input resources are fetched to the Grid worker node, and after that the jobs are executed. At specific time intervals, the job status is retrieved and the server database is updated according to those changes. When the job finishes, the results are displayed to the user, through the interface.
A. Coarse to fine interpolation
The first functionality of the GreenView application is the ‘coarse to fine interpolation’. It is necessary to have data fields of different environmental and biophysical variables on the same grid in order to efficiently use them in complex studies or models. This common grid is chosen based on the application. This procedure performs spatial interpolation of a coarsely gridded dataset to the (finer) target grid. There is a variety of interpolation methods available in the literature developed specifically for certain applications. In order to choose the most appropriate one, issues like precision, computation resources needed on a specific data set, parallelization possibilities and others must be considered. As the main goal of the process is to obtain environmental variables on the satellite grid, a nonlinear cosine function based distance weighted interpolation has been chosen. In this study for demonstration purposes, we used the 0.5°×0.5° resolution climate dataset of the PRUDENCE (Prediction of Regional scenarios and Uncertainties for Defining European Climate change risks and Effects) project as coarsely gridded data, supposing a hypothetic climate change impact study performed by the end-user. The target grid is the 1 km resolution MOD17 grid. At the end of the analysis phase, the algorithm should be described (in this case) as mathematical formulas. There are two formulas (1) and (2) used in order to achieve this interpolation. To simplify the understanding of the interpolation concept the next figure (Fig.2) present an example of how the Vm pixel is computed based on a four surrounding pixels.
B. Fine to coarse interpolation
This functionality from the GreenView application is the opposite of the coarse to fine method. This means that from a higher resolution temperature image is obtained a lower resolution one, based on a pixel averaging to compute the Vm.
C. Ecosystem model calibration
This GreenView component is used to determine the presence or absence of vegetation over a specific geographical area, or to determine in what quantity it appears. For a better way of understanding, the algorithm generates a pseudo colored map, in which every pixel represents a GPP value. In order to realize this, a gross primary production vegetation parameter is used (GPP, the total amount of carbon taken up by vegetation via photosynthesis during a specific time interval). GPP is measured several places worldwide using the so-called eddy covariance technique. In this study, the measurements at Hegyhátsál, Hungary have been used (http://nimbus.elte.hu/hhs/). The calibration is based on comparisons between the satellite and ground measurements. So, for a specific input dataset, based on a random generating algorithm and BIOME-BGC model, an output GPP dataset is obtained. Then this output dataset is compared with the ground measurements based on a merit function. After a number of N datasets are generated, we end up with N values for the merit function, from which the minimum value is selected. This minimum value represents the best calibration that can be done by using those generated datasets. The entire GPP computing algorithm is divided into four steps: a). the generation of a large number of random value sets, b). the simulation of the BIOME-BGC model c). the comparison between simulated and ground measured data for GPP parameter d). the selection of a single generated value set, based on merit function.
1. Participation to the Regional Environmental Science Workshop, Sofia, May 6-8, 2009. Presentations:
- Victor Bacu, Dorian Gorgan, Teodor Stefanut, "GreenView”. Reference: SEEGRIDSCI-NA4-RO-001-GreenView_EnvVO-a-2009-05-07.ppt
- Victor Bacu, Dorian Gorgan, Teodor Stefanut, "ESIP Platform”. Reference: SEEGRIDSCI-JRA1-RO-001-ESIP-a-2009-05-07.ppt
2. Participation to SCICOM09 - 7th International Conference on "Large-Scale Scientific Computations", 4-8 June, 2009, Sozopol, Bulgaria.Presentation:
- Dorian Gorgan, Teodor Stefanut, Victor Bacu, Danut Mihon, Denisa Rodila, “Grid based Environment Application Development Methodology”
3. Participation to HiPerGRID - 3rd International Workshop on High Performance Grid Middleware, 28 May, 2009, Bucharest. Presentation:
- Victor Bacu, Teodor Stefanut, Denisa Rodila, Dorian Gorgan, “Process Description Graph Composition by gProcess Platform"
4. Participation to the Student Scientific Communication Session, 22 May 2009, Technical University of Cluj-Napoca. Presentations:
- Denisa Rodila, Victor Bacu, Dorian Gorgan, “Integration of Satellite Image Operators as Workflows in the gProcess Application”
- Danut Mihon, Dorian Gorgan, Victor Bacu, Teodor Stefanut, "Grid Based Environment Application Development- Green View"
1. Gorgan, D., Bacu, V., Stefanut, T., Rodila, D., "Grid based Satellite Image Processing Platform for Earth Observation Applications Development". IDAACS'2009 - IEEE Fifth International Workshop on "Intelligent Data Acquisition and Advanced Computing Systems: Technology and Applications", 21-23 September 2009, Rende, Cosenza, Italy (2009)
2. Gorgan, D., Stefanut, T., Bacu, V., Mihon, D., “Grid based Environment Application Development Methodology”, SCICOM09 - 7th International Conference on "Large-Scale Scientific Computations", 4-8 June, Sozopol, Bulgaria, ISBN 978-3-642-12534-8, pp. 499-506, (2010)
3. Bacu V., Stefanut T., Rodila D., Gorgan D., “Process Description Graph Composition by gProcess Platform”. HiPerGRID - 3rd International Workshop on High Performance Grid Middleware, 28 May, Bucharest. Proceedings of CSCS-17 Conference, Vol.2. ISSN 2066-4451, pp. 423-430, (2009)
4. Rodila D., Bacu V., Gorgan D., “Integration of Satellite Image Operators as Workflows in the gProcess Application”. ICCP2009, 27 Aug, 2009 Cluj-Napoca, pp. 355 - 358, ISBN: 978-1-4244-5007-7
5. Mihon D., Bacu V., Stefanut T., Gorgan D., “Grid Based Environment Application Development – GreenView Application”. ICCP2009 - IEEE 5th International Conference on Intelligent Computer Communication and Processing, 27 Aug, 2009 Cluj-Napoca, pp. 275 - 282, ISBN: 978-1-4244-5007-7
6. Denisa D. Rodila, Victor Bacu, Dorian Gorgan, "Semantic Annotation based Service Composition for Grid Workflow Description and Execution". SYNASC Symposium, 26-29, September 2009, Timisoara, pp. 245-253, ISBN 978-0-7695-3964-5
7. Gorgan D., "Earth Science Application Development Methodology by ESIP and gProcess Platforms". Abstract sent for the workshop "Federation and interoperability of Earth Science Digital Repositories: data discovery, access and visualization" within the Conference EGEE'09 - Uniting our strengths to realise a sustainable European grid, 21-25 Sept, Barcelona (2009)
8. Gorgan D., Mihon D., Bacu V., Mészáros R., Gelybó G., Stefanut T., Practical Considerations on the GreenView Application Development and Execution over SEE-GRID, SEE-GRID-SCI USER FORUM 2009, Bogazici University, Istanbul, Turkey, December 9-10, 2009, ISBN: 978-975-403-510-0
9. Mihon D, Bacu V, Meszaros R, Gelybo G, Gorgan D, "Satellite Image Interpolation and Analysis through GreenView Application," Complex, Intelligent and Software Intensive Systems, International Conference, pp. 514-519, 2010 International Conference on Complex, Intelligent and Software Intensive Systems, Krakow, Poland, February 15-February 18, ISBN: 978-0-7695-3967-6 (2010)
You could contact us at: This e-mail address is being protected from spambots. You need JavaScript enabled to view it

